This page is used to collate and summarise Road Safety Data for Exeter as published on data.gov.uk. The focus is on collisions in which at least one participant was a cyclist. The Road Safety Data is made available in around October for the previous calendar year.
Cyclestreets produce an excellent interactive viewer which can be used to visualise and dive into collison data.
The collisions and casualties data are based on personal-injury collisions that are reported to the police. These data are incomplete as a substantial proportion of personal-injury collisions are not reported to the police.
The DfT's Guide to such statistics categorises traffic collisions into three categories - Fatal, Serious and Slight. In brief ...
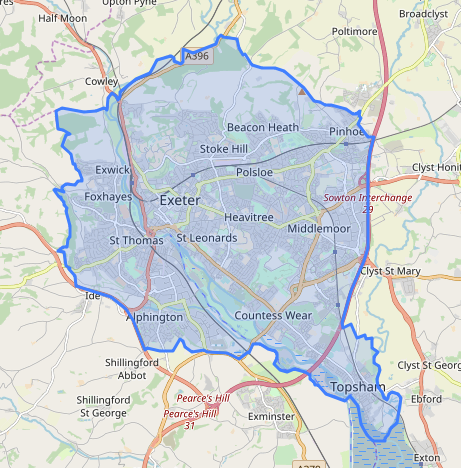
The area chosen for analysis was the Exeter City Council Area. This area includes Topsham but excludes Exminster, Broadclyst and Cranbrook.
Analysing all collisions (regardless of vehicle type) for this area by year into the three categories (Fatal, Severve, Slight) produces the following figures.
| Year | Fatal | Serious | Slight | Fatal + Serious | Total |
|---|---|---|---|---|---|
| 2005 | 4 | 19 | 377 | 23 | 400 |
| 2006 | 1 | 19 | 360 | 20 | 380 |
| 2007 | 2 | 27 | 319 | 29 | 348 |
| 2008 | 2 | 25 | 292 | 27 | 319 |
| 2009 | 3 | 16 | 277 | 19 | 296 |
| 2010 | 1 | 24 | 235 | 25 | 260 |
| 2011 | 0 | 20 | 250 | 20 | 270 |
| 2012 | 3 | 30 | 240 | 33 | 273 |
| 2013 | 0 | 37 | 207 | 37 | 244 |
| 2014 | 4 | 31 | 193 | 35 | 228 |
| 2015 | 3 | 33 | 226 | 36 | 262 |
| 2016 | 0 | 32 | 192 | 32 | 224 |
| 2017 | 1 | 40 | 176 | 41 | 217 |
| 2018 | 4 | 42 | 167 | 46 | 213 |
| All Collision Totals | 28 | 395 | 3,511 | 423 | 3,934 |
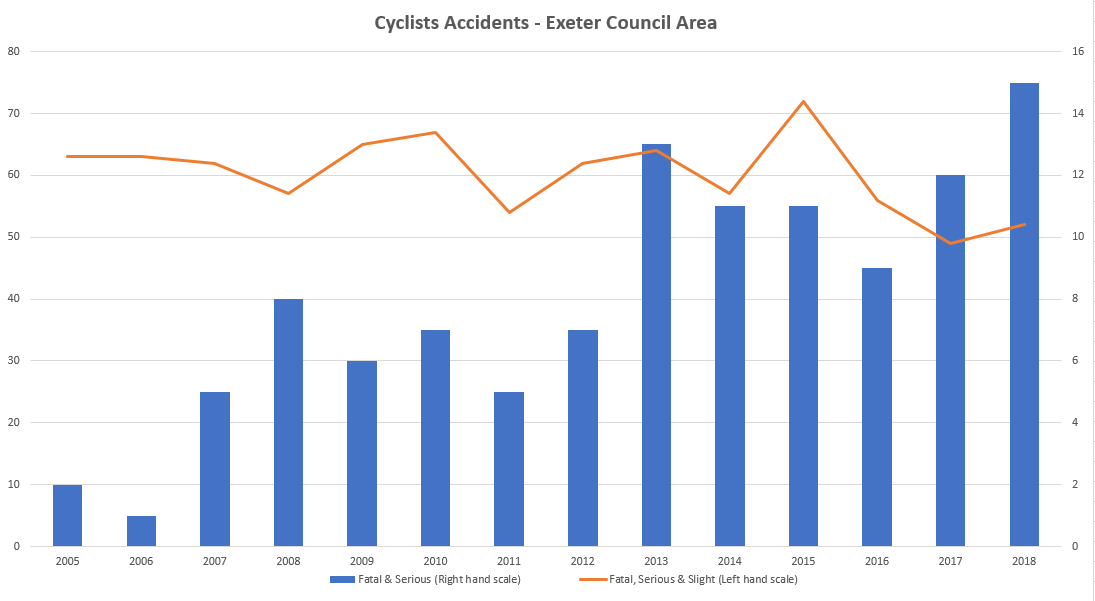
Analysing collisions which involve at least one cyclist for this area by year into the three categories (Fatal, Severve, Slight) produces the following.
The number of 'Slight' collisions reported appears to be relatively constant or to have decreased slightly, but there are indications that the number of 'Serious' collisions may have increased.
| Year | Fatal | Serious | Slight | Fatal + Serious | Total |
|---|---|---|---|---|---|
| 2005 | 0 | 2 | 61 | 2 | 63 |
| 2006 | 0 | 1 | 62 | 1 | 63 |
| 2007 | 0 | 5 | 57 | 5 | 62 |
| 2008 | 0 | 8 | 49 | 8 | 57 |
| 2009 | 1 | 5 | 59 | 6 | 65 |
| 2010 | 0 | 7 | 60 | 7 | 67 |
| 2011 | 0 | 5 | 49 | 5 | 54 |
| 2012 | 0 | 7 | 55 | 7 | 62 |
| 2013 | 0 | 13 | 51 | 13 | 64 |
| 2014 | 2 | 9 | 46 | 11 | 57 |
| 2015 | 1 | 10 | 61 | 11 | 72 |
| 2016 | 0 | 9 | 47 | 9 | 56 |
| 2017 | 0 | 12 | 37 | 12 | 49 |
| 2018 | 1 | 14 | 37 | 15 | 52 |
| Cyclist Totals | 5 | 107 | 731 | 112 | 843 |
| Cycists as Percent of All Collisions | 18% | 27% | 21% | 26% | 21% |
| All Collision Totals | 28 | 395 | 3,511 | 423 | 3,934 |
Thus in Exeter over the fourteen year period (2005-2018 inclusive) there were a total of 423 serious or fatal road collisions involving all types of vehicle. Of these 112, or 26%, involved a cyclist.
In the seven year period 2005-2011 inclusive there were 34 fatal or serious collisions involving cyclists. In the seven year period 2012-2018 inclusive there were 78, an increase of 129%.
The comparable figures for all types of vehicle (including cyclists) are 163 (2005-2011) and 260 (2012-2018), an increase of 60%. If we exclude collisions involving cyclists, then the figures are 129 (2005-2011) and 182 (2012-2018) an increase of 41%.
Thus it would appear that between these two periods fatal or serious injuries to cyclists have increased 129% (more than double), whereas fatal or serious injuries to other vehicle users have increased by 41%.
NB: these figures need to be checked more carefully as it is possible in a vehicle-bike accident for a car driver or passenger to be badly injured (e.g. swerving to avoid a cyclist).
The collision datasets contain information on the vehicles involved in reported collisions (e.g. car and bike). The following table shows the numbers of collisions involving specific combinations of vehicles. Car-bike collisions account for 87% of all collisions involving cyclists.
Vans (3.2%) and buses (3.1%) pose a three-fold greater risk to cyclists in Exeter than do lorries (1.1%).
The 'other' category contains a miscellaneous range of collisions such as bike-bike, multi-vehicle collisions, etc.
| Year | bike car | bike van | bike bus or coach | bike only | bike motorbike | bike lorry | bike taxi | bike other | Total | |
|---|---|---|---|---|---|---|---|---|---|---|
| 2005 | 53 | 0 | 3 | 2 | 3 | 1 | 1 | 0 | 63 | |
| 2006 | 58 | 0 | 3 | 0 | 1 | 0 | 0 | 1 | 63 | |
| 2007 | 55 | 1 | 4 | 0 | 1 | 0 | 1 | 0 | 62 | |
| 2008 | 50 | 1 | 2 | 1 | 1 | 1 | 0 | 1 | 57 | |
| 2009 | 58 | 2 | 2 | 3 | 0 | 0 | 0 | 0 | 65 | |
| 2010 | 58 | 2 | 3 | 2 | 1 | 0 | 0 | 1 | 67 | |
| 2011 | 45 | 2 | 2 | 2 | 2 | 1 | 0 | 0 | 54 | |
| 2012 | 58 | 0 | 1 | 1 | 1 | 0 | 0 | 1 | 62 | |
| 2013 | 55 | 4 | 2 | 2 | 0 | 1 | 0 | 0 | 64 | |
| 2014 | 48 | 4 | 0 | 1 | 0 | 2 | 2 | 0 | 57 | |
| 2015 | 59 | 4 | 3 | 4 | 1 | 1 | 0 | 0 | 72 | |
| 2016 | 48 | 4 | 1 | 1 | 2 | 0 | 0 | 0 | 56 | |
| 2017 | 42 | 1 | 0 | 2 | 1 | 2 | 1 | 0 | 49 | |
| 2018 | 46 | 2 | 0 | 3 | 0 | 0 | 1 | 0 | 52 | |
| Totals | 733 | 27 | 26 | 24 | 14 | 9 | 6 | 4 | 843 | |
| Percent | 87.0% | 3.2% | 3.1% | 2.8% | 1.7% | 1.1% | 0.7% | 0.5% | 100.0% |