
Cyclists submit videos to the Police's Operation SNAP system. A significant number of these videos concern 'close passes'.
In the Highway Code drivers are advised
"to give cyclists ... at least as much room as you would when overtaking a car. As a guide: leave at least 1.5 metres when overtaking cyclists at speeds of up to 30mph, and give them more space when overtaking at higher speeds."
High speed passes are particularly unnerving for cyclists. This is true whether being overtaken or facing oncoming vehicles.
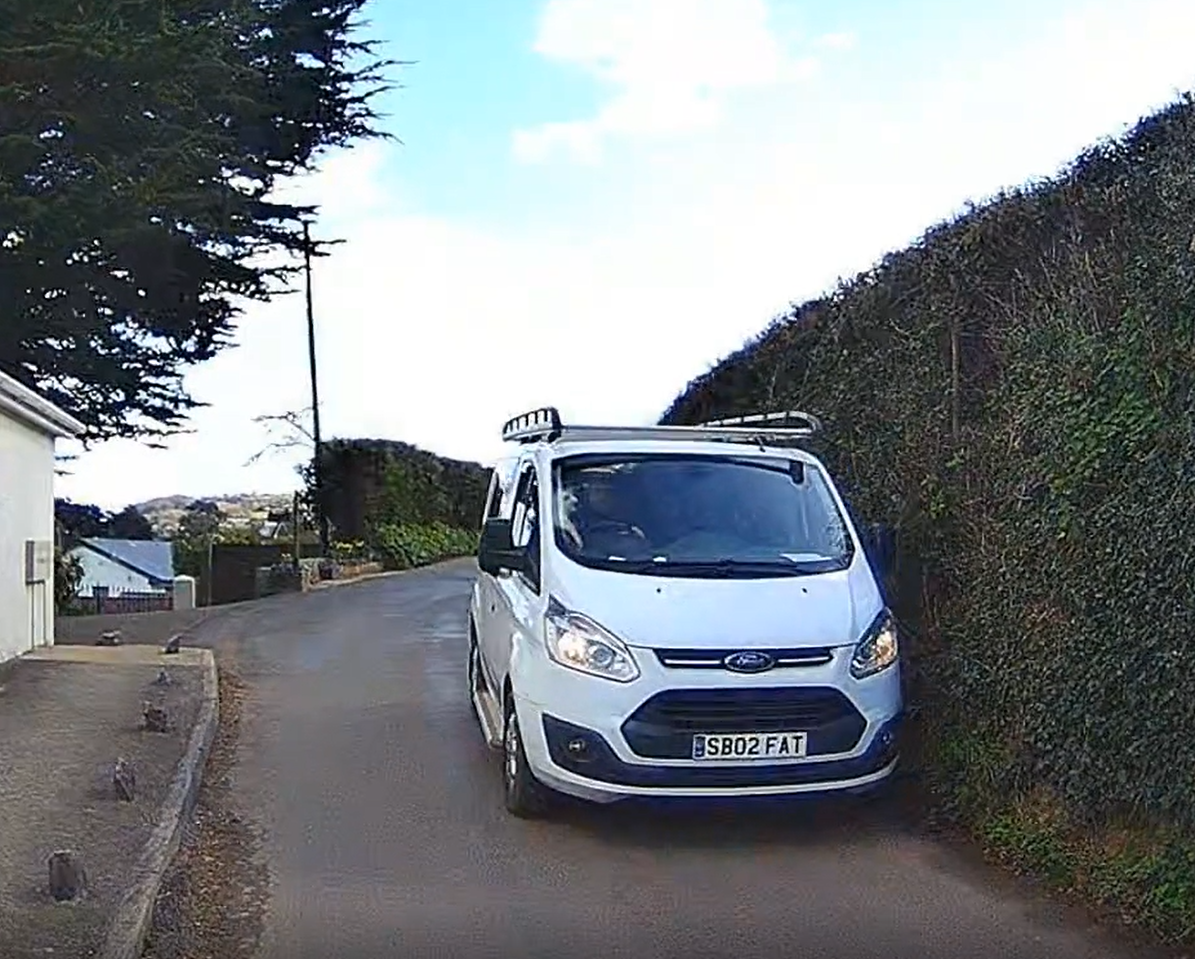
This page describes one technique for estimating the relative speed of overtaking vehicles from video footage.The animation below shows a sequence of still images extracted from helmet video camera footage at half-second intervals. As the vehicle approaches it gets bigger in the frame, and as it recedes it gets smaller.
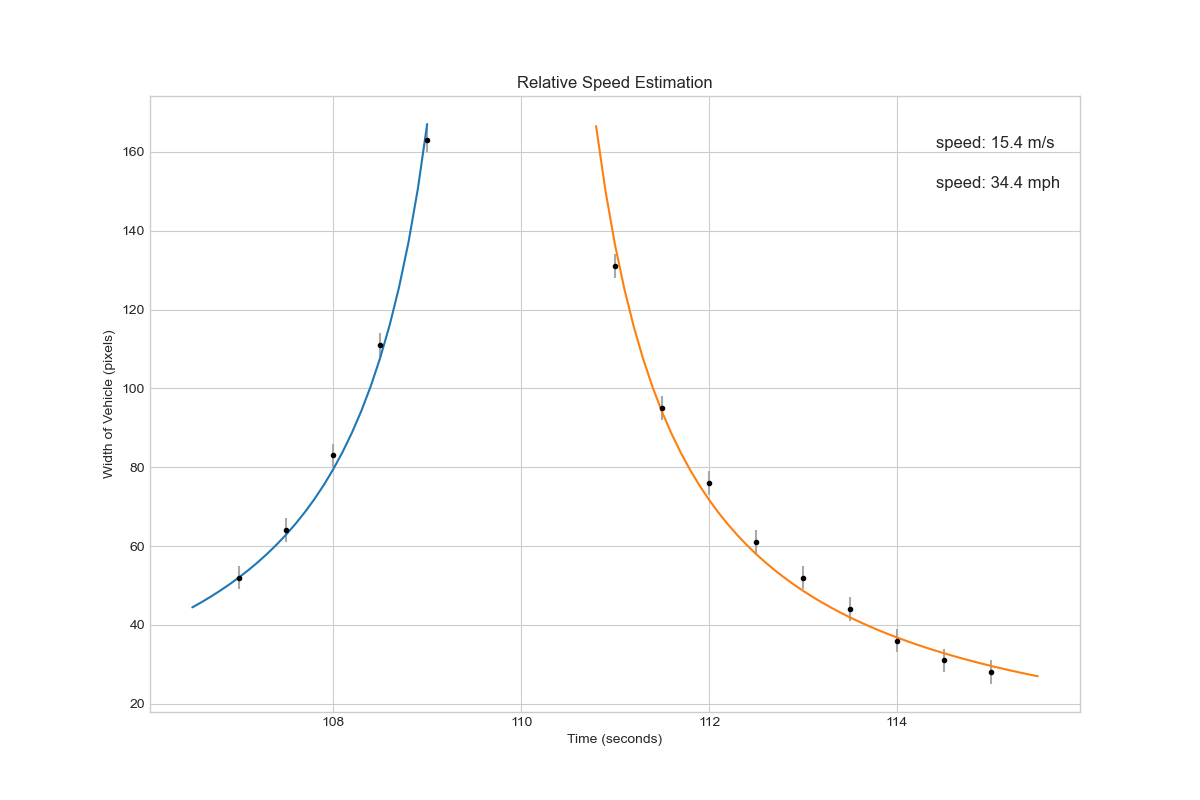
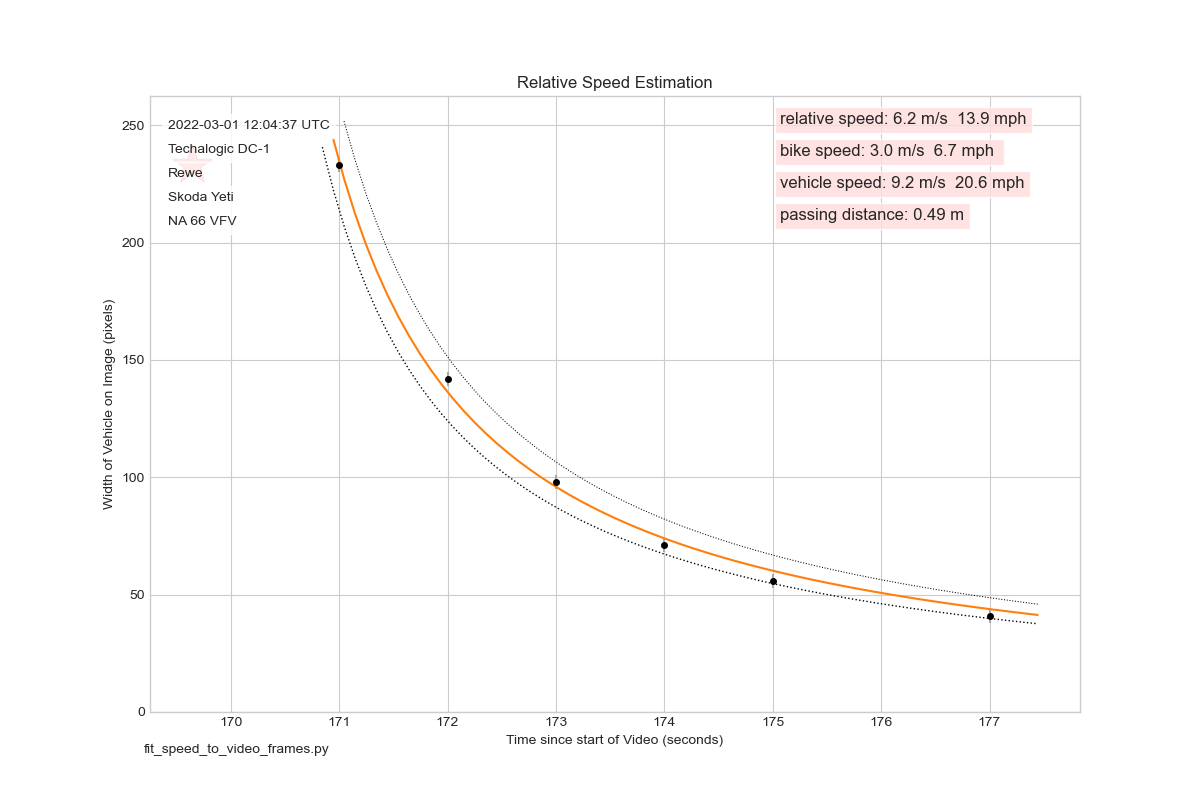
From each of these stills the apparent width of the vehicle can be measured in pixels. The graph below shows the number of pixels increasing as the van approaches and decreasing as it moves away.
The shape of the curve depends on
In this case
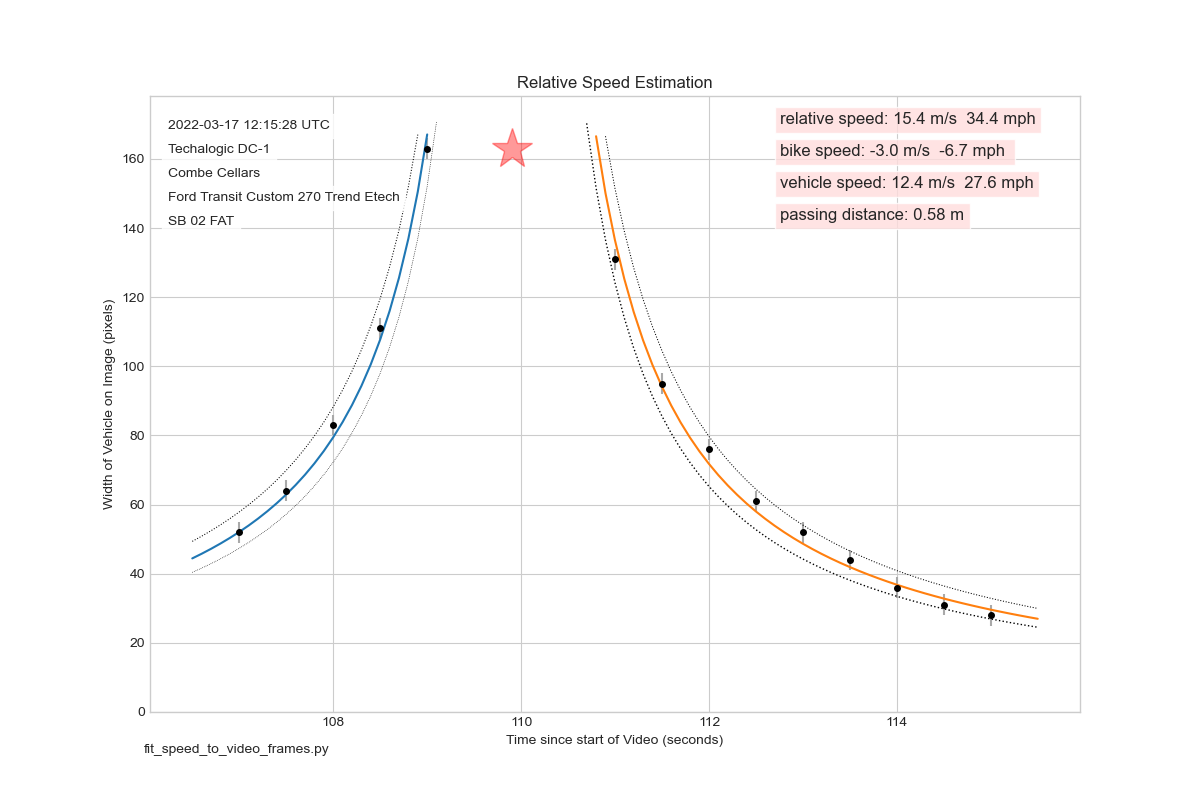
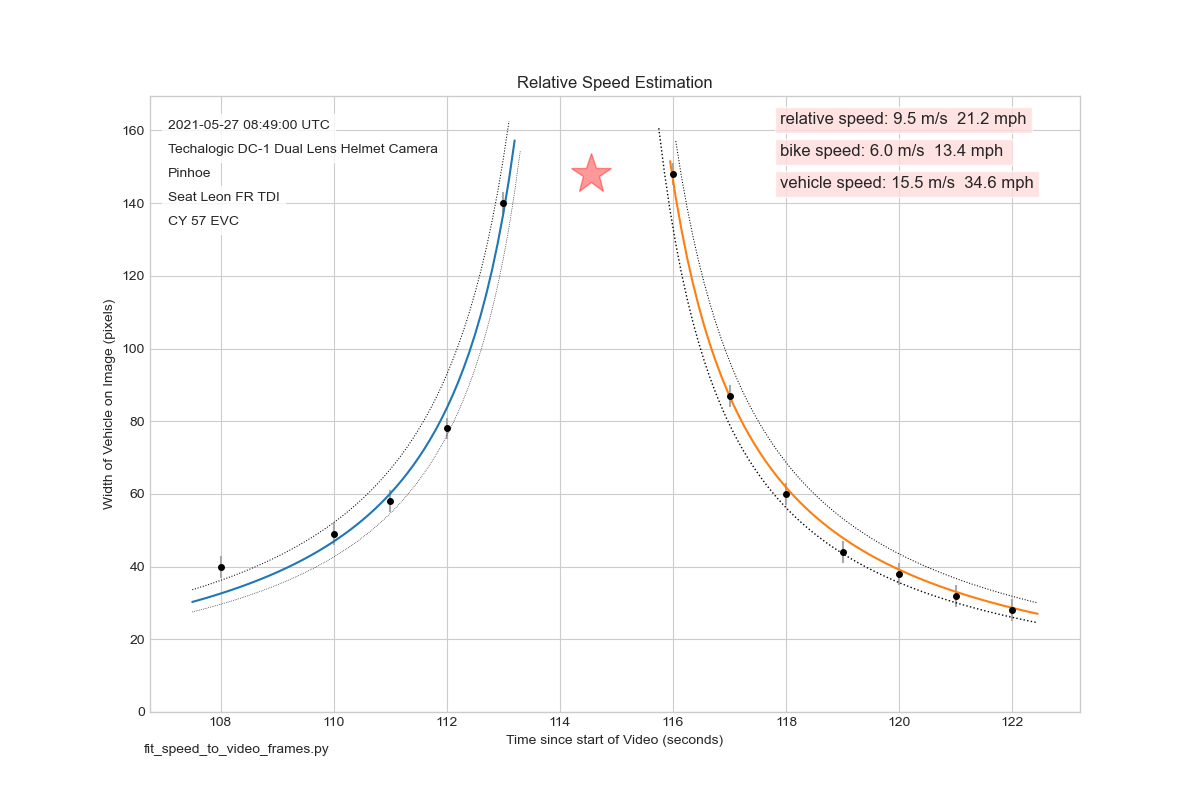
For any given relative speed it is possible to calculate the width the vehicle would appear in the video (in pixels). This allows the observed curve to be matched (or fitted) to the calculated curve which has the 'best matched' relative speed.
This is shown in the graph below. The blue line shows the calculated width as the vehicle approaches, and the orange line the calculated width as it recedes.
In this case the best match occurs for a relative speed of 15.4 m/s (or 34.4 mph)
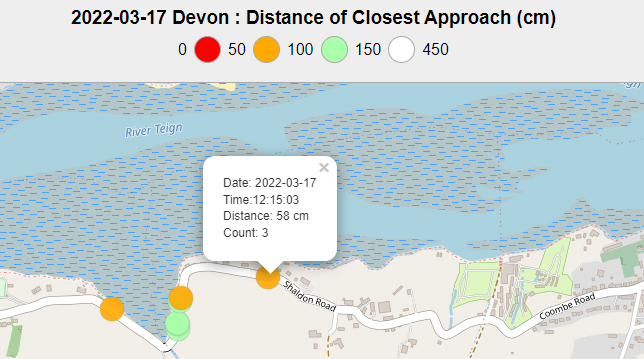
At this time the cyclist was travelling at 3.5 m/s (7.8 mph) so the van would have been travelling at 34.4 - 7.8 = 26.6 mph.
An ultrasound measurement (shown below) shows that the van passed within 58 cm of the cyclist.
The fitting of the calculated curve to the observed values is done using the Python scipy function scipy.optimize.minimize.
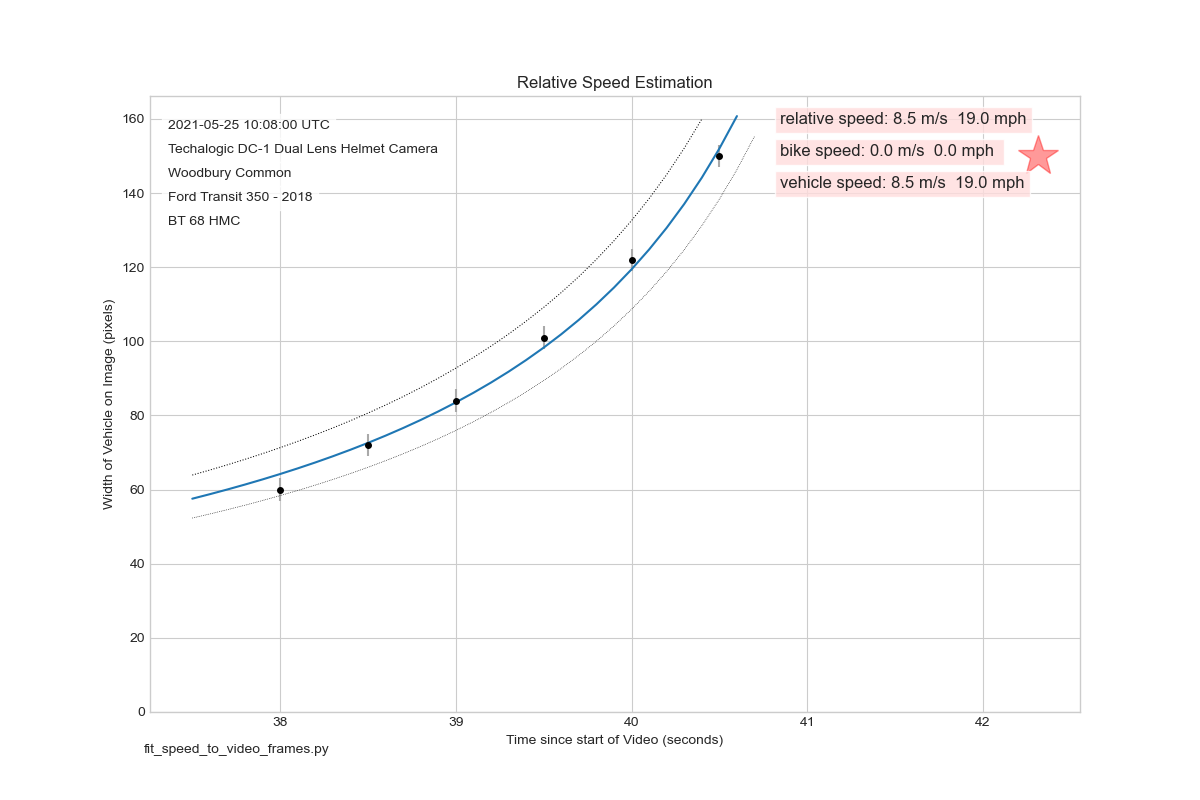
The following graph shows the same fitted curve together with (as dotted lines) the curves that would result if the vehicle's speed was 10% more or 10% less than that calculated. This indicates that this technique can estimate speeds to better than a few percent.
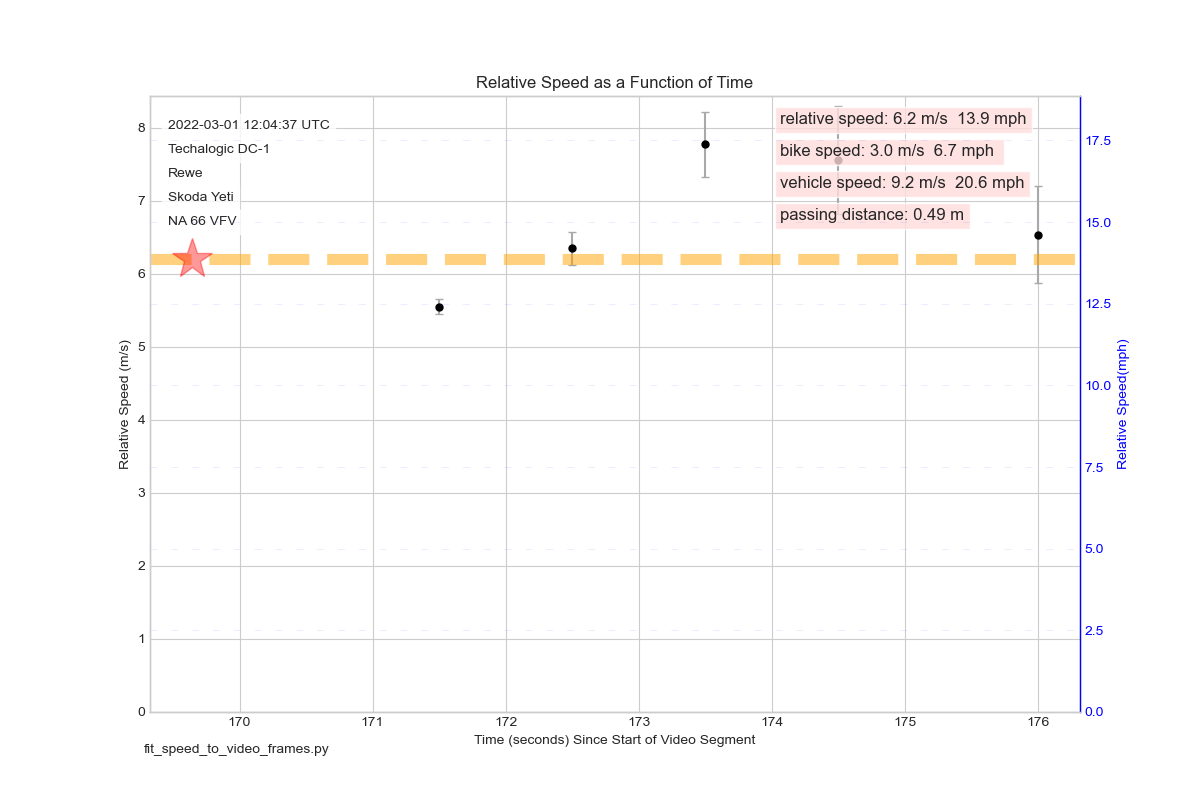
The red star shows the time at which the van passes the cyclist.
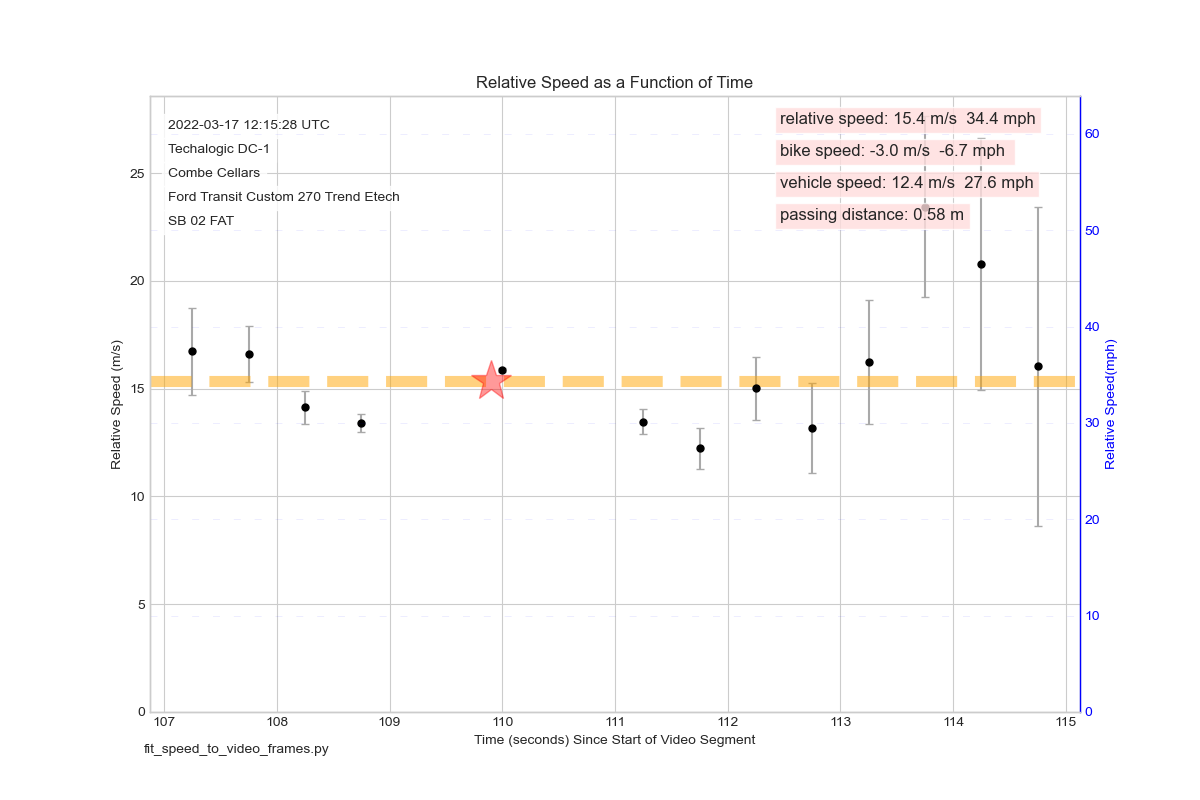
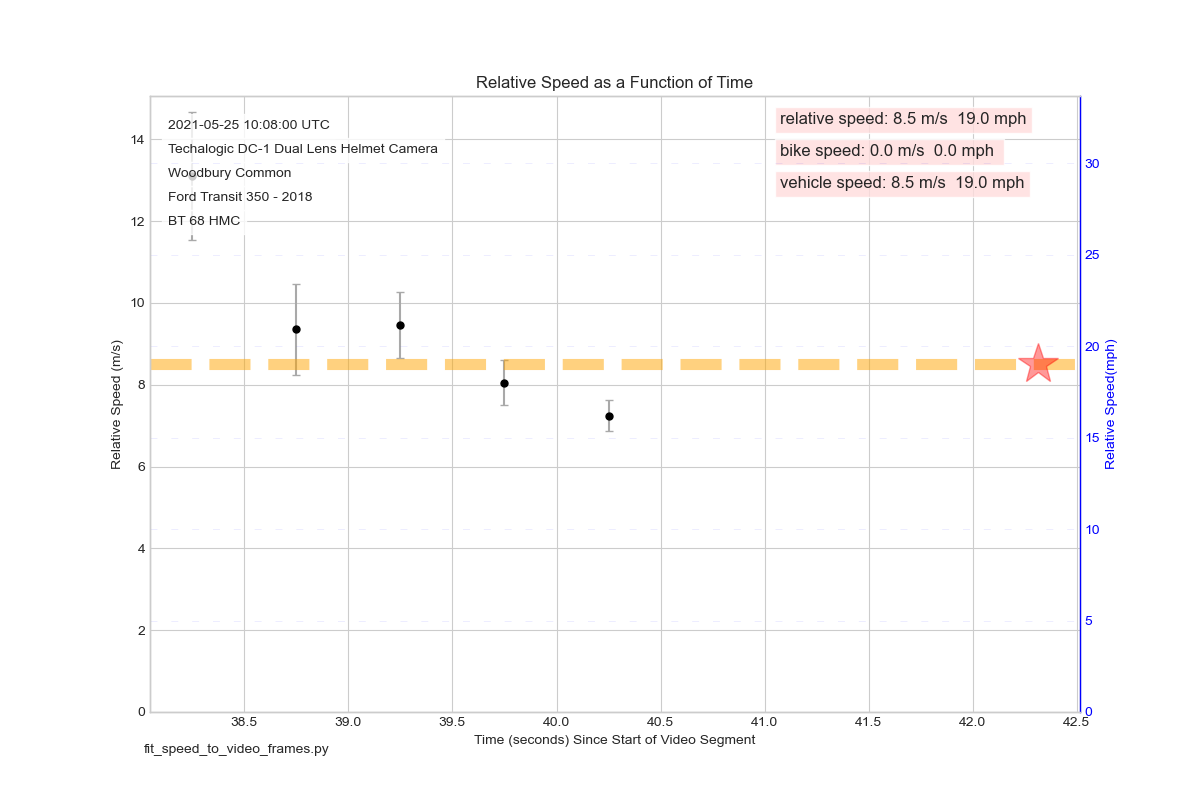
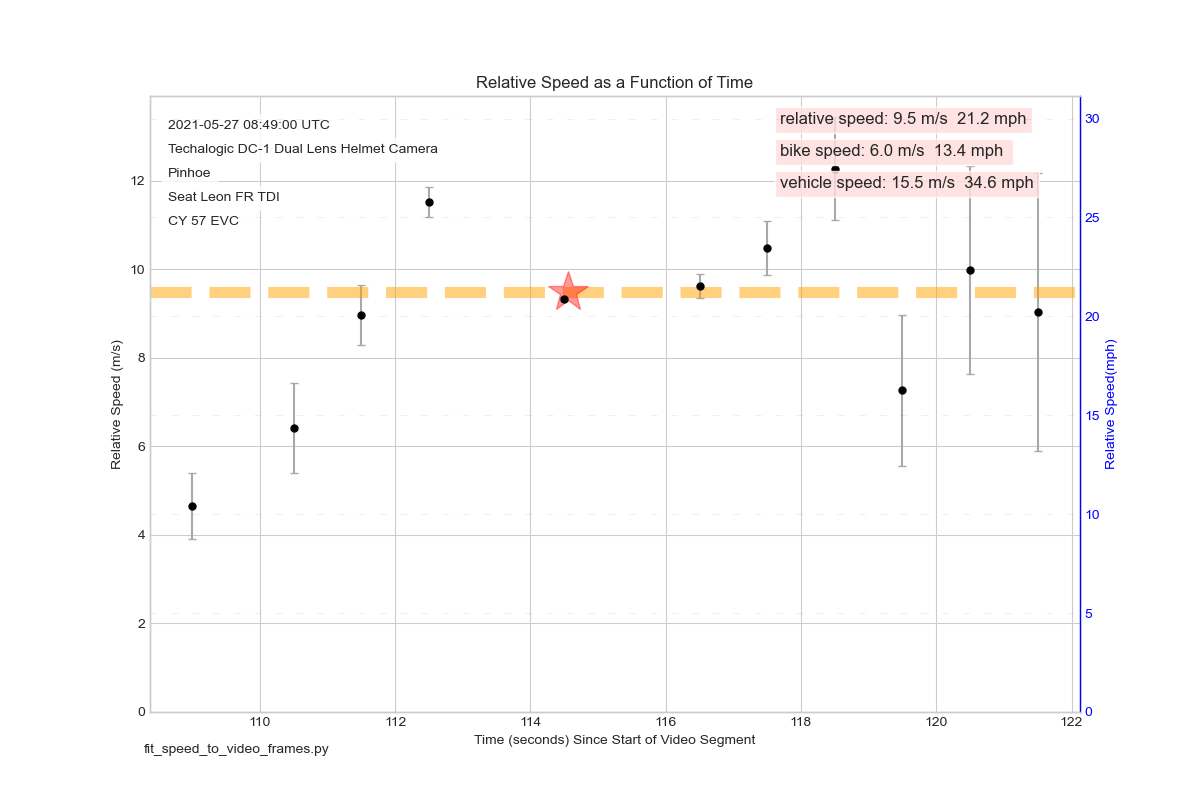
The second graph shows the speed of the van estimated from consecutive pixel width measurements. The red star shows the time at which the van passed the cyclist. The accuracy of the speed measurements is indicated by the length of the error bars. The most accurate speed measurement is taken using the pixel width of the van immediately before and after the pass. Measurements taken using pairs of pixel measurements further away from the pass are less accurate.
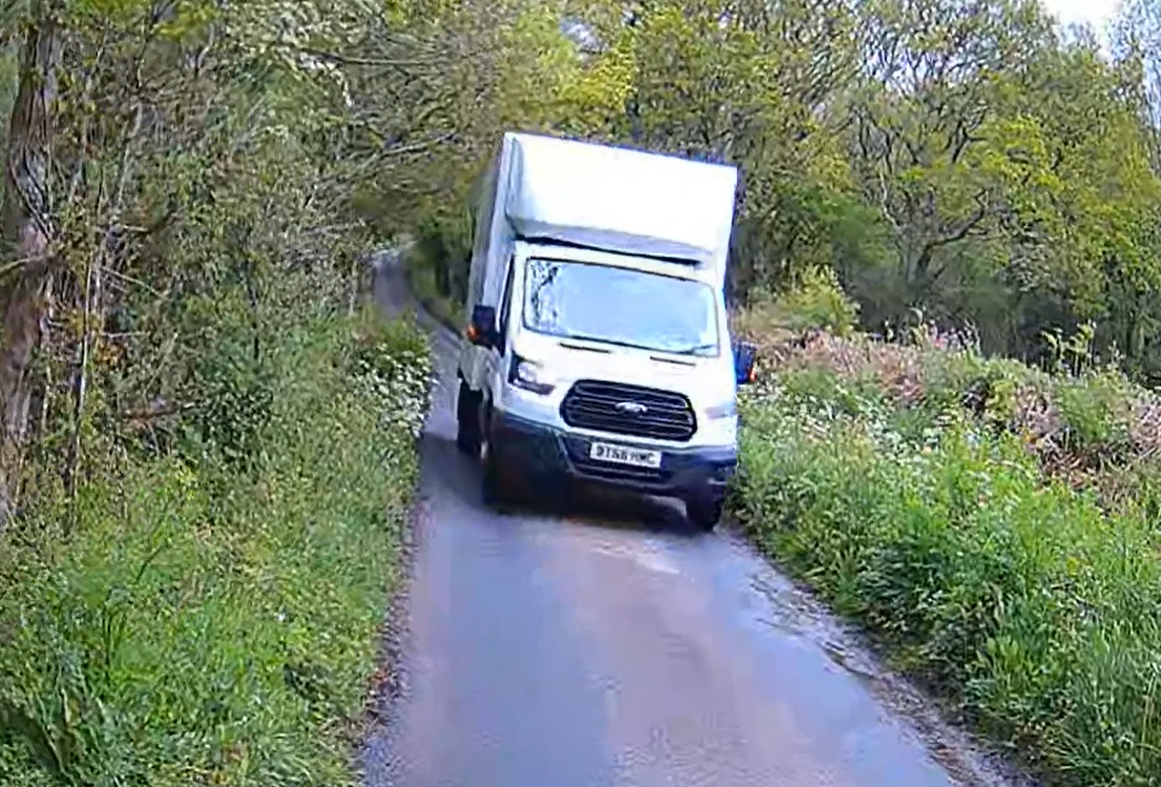
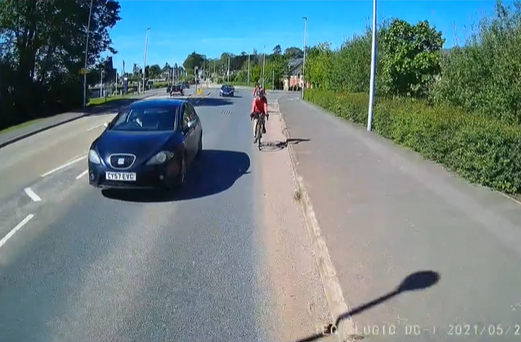
Van driving towards cyclists in narrow lane - forcing cyclists off the road.
Close pass from behind alongside a traffic island.
The gap between the pavement and the island was measured at 3.26 m, the Sean Leon is 1.76 m wide. Allowing for the cyclist riding 2' away from the curb and for the wing mirrors leaves a gap of less than 0.44 m.
The speed graph below shows the car accelerating away from the traffic lights, reaching a speed of 36.6 mph, and later slowing as it caught up with traffic ahead.
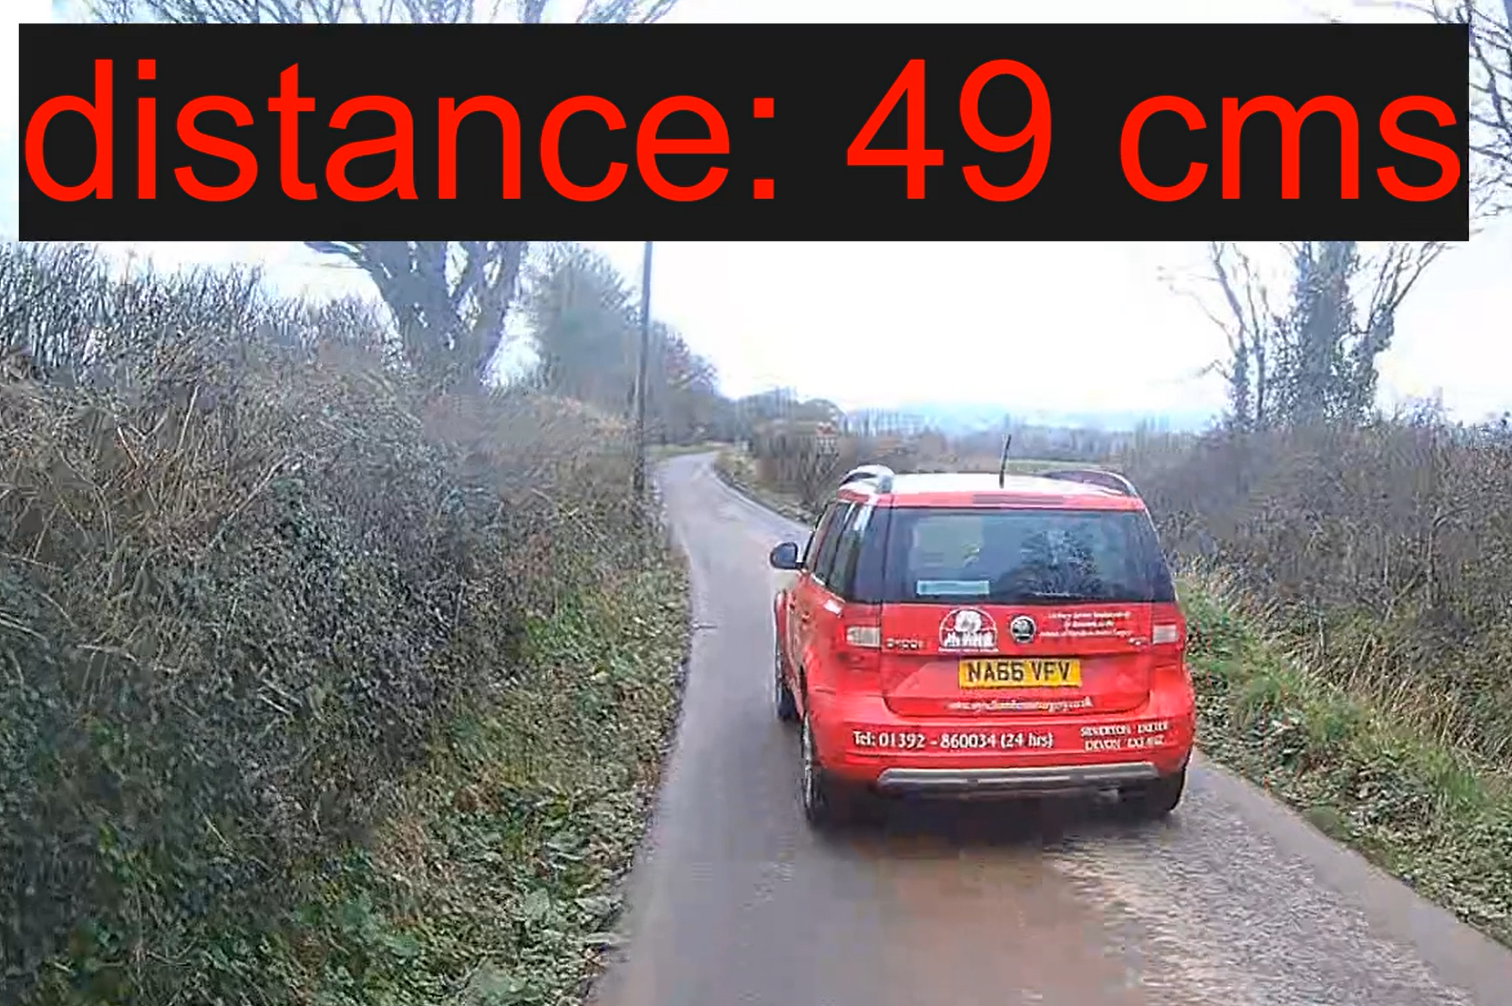
Close pass from behind in country lane. Closest distance is 49 cms.
Close pass from ahead in narrow lane. Closest distance is 58 cms